There’s a stat for that.
What exactly is the best metric to use for measuring the success of an app? Is it the number of downloads? Most used? Revenue generated? Let's dig into the data so you can be the judge of that.
Top app statistics
I have an idea for an app, but now what? Do your research to get the lay of the land.
If you're on a mission, feel free to jump ahead:
The list of top performing apps is no real surprise – it includes WhatsApp Messenger, Facebook Messenger, and Instagram, with a handful of addicting games like Roller Splat! But, some of these stats might leave you a little shocked at just how much we’ve come to rely on technology.
App download statistics
- Global app downloads exceeded 194B in 2018, up 35% from 2016. (App Annie)
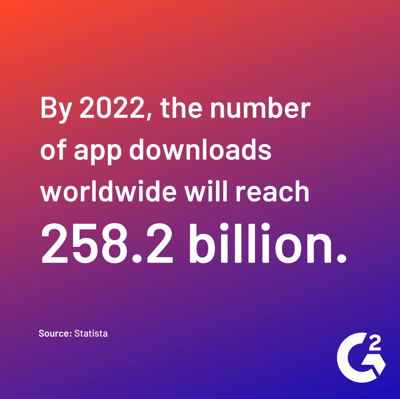
- By 2022, the number of app downloads worldwide will reach 258.2 billion. (Statista)
- Gaming is the top category by app downloads in both the Apple App Store and the Google Play Store. (Space-O Technologies)
- In 2018, apps outside of games accounted for 65% of total global downloads, consistent with two years prior. (App Annie)
- Downloads of the top 5 food delivery apps, including UberEATS and Zomato, have grown 115% in 2018 vs. 2016. (App Annie)
- The top mobile app publisher worldwide by downloads for Q4 2018 was Facebook with more than 800 million new installs during the quarter. (Sensor Tower)
- There are 2.2 million apps available for download in the Apple App Store. (AppInventiv)
- The Google Play Store has 2.6 million apps available for download. (PCMag)
- There are roughly 476,000 apps available for download in the Amazon Appstore. (Statista)
- On average, the Apple App Store release 1,251 apps per day. (42 Matters)
- The Google Play Store releases 4,006 apps per day on average. (42 Matters)
- In 2018, Google Play Store downloads grew by 14%, while the Apple App Store had just a 3% growth rate. (Sensor Tower)
App usage statistics
- The average smartphone user uses at least 9 apps per day and over 30 apps per month. (App Annie)
- On average, Americans check their phone on average once every 12 minutes – that’s 80 times per day. (NY Post)
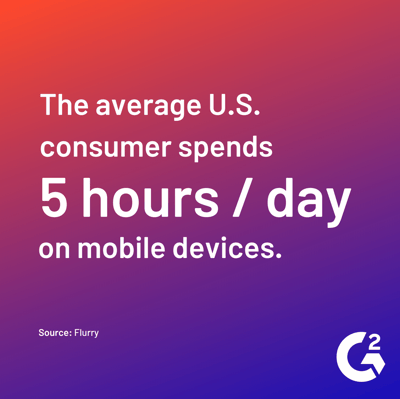
- Further, the average U.S. consumer spends a whopping 5 hours a day on these devices. (Flurry)
- Smartphone users spend 50% of their time in one app and 97% in their top 10 apps. (ComScore)
- Mobile users are spending 87% of their time in apps, versus just 13% on the web. (ComScore)
- Social media apps dominate the most frequently used apps (39%), while gaming and communication/messaging apps tie for second (10%). (The Manifest)
- Personalized push notifications see 9.06% higher open rates than generic messaging and adding emojis to them results in 70% higher click-through rates. (CleverTap)
- Roughly 37% of millennials list data usage as a key factor when deciding if they like a mobile app. (MindSea)
- In mobile gaming, women a more receptive audience for downloads and in-app purchases, and have a 42% higher seven-day retention on average compared to men. (Mixpanel)
- The average app loses 77% of its daily active users, in just three days. (Amplitude)
- Users tend to keep an app for just under 6 days before losing interest, and usually uninstall it altogether. (Adjust)
- Of the mobile users who stop using an app, 30% would use it again if offered a discount, and 24% would use it again if offered exclusive or bonus content. (Think with Google)
|
BONUS STAT: Even though the app industry is booming, 57% of apps downloaded are deleted within 30 days. But why? App design – see what the best apps are doing right.

|
App revenue statistics
- By 2020, mobile apps are expected to generate $189 billion in revenue. (Business of Apps)
- Candy Crush Saga was the top grossing app in the United States for April 2019 with more than $32.5 million in user spending, which represented a 7% increase from April 2018. (Sensor Tower)
- Globally, on a category level, games accounted for 74% of consumer spend in 2018. (App Annie)
- Consumer spend in non-gaming apps grew 120% from 2016, fueled by in-app subscriptions. (App Annie)
- As of Q1 2019, Netflix is the top grossing iOS app at 19% of total revenue and the 5th highest Android app at 11% in the U.S. (Apptopia)
- Search continues to be the major channel in generating mobile ad revenue, contributing $17.7 billion out of $32.9 billion in 2017. (Business of Apps)
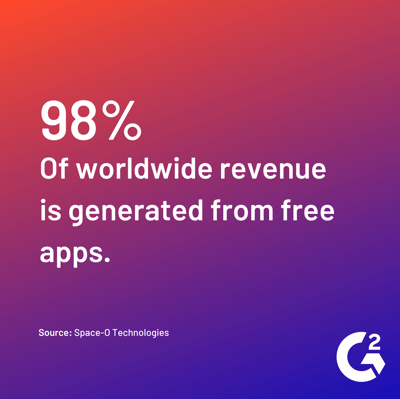
- 98% of worldwide revenue is generated from free apps. (Space-O Technologies)
- The average U.S. iPhone user spends $40 on apps & in-app purchases per year. (9to5 Mac)
- On average, Android users spend less than half as much on in-app purchases per app, $0.43 vs. $1.08 respectively. (Invesp)
- Over $2.2B was spent on the top 5 video streaming services, including Netflix and YouTube, in 2018 worldwide. This is predominantly driven by subscription revenue. (App Annie)
- In 2017, Apple’s App Store generated $40 billion and the Google Play Store generated $21 billion, with third-party Android stores brought in an additional $20 billion. (Business of Apps)
Ok, we get it. Now the questions shift from “Should I make an app?” to “How can I make my app stand out?” Learn more about how to boost downloads, encourage continued use, and increase revenue with app store optimization.
Apps are big business
It’s apparent from these statistics that apps aren’t going anywhere. Even the stats about a declining publishing rate point to a hot market. In the coming years, app stores will likely put greater emphasis on quality over quantity to better serve both the end users and the bottom line.
If you're curious about how to actually measure your app's performance, mobile app analytics software is a great place to start. These tools provide user behavior data, demographic and geographic information, market behaviors, usage analysis, and more.


 by Mara Calvello
